For the complete documentation index, see llms.txt. Markdown versions of all docs pages are available by appending .md to any docs URL.
Debug your setup
Debug your agentgateway environment.
Inspect and troubleshoot agentgateway proxies through the admin endpoints and the agctl command-line tool.
Admin endpoints
Each agentgateway pod runs an admin server on port 15000. The admin server provides the following endpoints for inspection and debugging.
| Endpoint | Description |
|---|---|
/config_dump | Returns the runtime configuration that the proxy has loaded, including binds, listeners, routes, backends, workloads, services, and policies. |
/debug/trace | Streams a JSON-over-SSE trace of the next request that the proxy handles. The agctl trace command consumes this endpoint. |
/logging | Get and set the logging level at runtime. |
/memory | Dump allocator and process memory statistics. |
/debug/pprof/profile | Build a CPU profile by using the pprof profiler. Use ?seconds=N to set the duration (1–300s, default 10s). |
/debug/pprof/heap | Collect heap profiling data. |
/debug/tasks | Inspect the live tokio task tree. |
/quitquitquit | Trigger a graceful shutdown of the proxy. |
To inspect the configuration that a gateway proxy has loaded and to capture per-request traces, use the agctl command-line tool. agctl resolves the proxy pod for you, opens a port-forward, and renders the admin output in formats that are easier to scan than raw JSON.
Before you begin
Check the gateway, route, and policy status
Most routing and policy issues surface in the status of the corresponding Kubernetes resource. Check these first.
Verify that the agentgateway control plane and proxy pods are running.
kubectl get pods -n <namespace>Verify the Gateway is
AcceptedandProgrammed.kubectl get gateway -A kubectl get gateway <name> -n <namespace> -o yamlCheck the HTTPRoute for
AcceptedandResolvedRefsconditions.kubectl get httproute -Akubectl get httproute <name> -n <namespace> -o yamlCommon issues to check for:
- The wrong backend is selected.
- The wrong parent Gateway is referenced.
- Multiple HTTPRoutes conflict by having identical matchers or by having no matchers (and so default to
/).
Inspect the loaded configuration
Sometimes a route is Accepted but the proxy still does not behave as expected. To see what the proxy actually loaded, dump its runtime configuration.
Render a summary of the routes, backends, and policies that the gateway has loaded.
agctl config all gateway/<gateway-name> -n <namespace> -o yamlInspect the backends that the gateway is sending traffic to and their endpoint health.
agctl config backends gateway/<gateway-name> -n <namespace>Example output:
TYPE     NAME       NAMESPACE            ENDPOINT                    HEALTH  REQUESTS  LATENCY
Backend  openai     agentgateway-system  backend                     1.00    1         4682.37ms
Service  ext-authz  backend-extauth      ext-authz-7c7596b5f6-tvs28  0.70    4         0.00ms
Service  httpbin    backend-extauth      httpbin-7dc88b5fbc-zqrfn    1.00    2         3.06ms
For complete steps, see Inspect agentgateway configuration.
Trace requests
To see how a specific request flows through agentgateway, use agctl trace. The trace shows you the route that was selected, the policies that were applied, the backend that was chosen, and the response status. Tracing helps you understand why a request did or did not match a route, why a policy was or was not applied, or why a request returned an unexpected status.
agctl trace gateway/<gateway-name> -n <namespace> --port <listener-port> -- http://<host>/<path>agctl opens a port-forward to the proxy pod, captures the trace, sends the request, and renders the result in a text-based terminal user interface (TUI). Use --raw to print JSON Lines instead.
For complete steps, see Trace requests with agctl.
Enable debug logs
Agentgateway uses the same level syntax as RUST_LOG: error, warn, info, debug, and trace. You can change the level at runtime through the proxy’s admin endpoint.
Open a port-forward to the proxy.
kubectl port-forward deploy/<gateway-name> -n <namespace> 15000 &Set the log level.
curl -X POST "http://localhost:15000/logging?level=debug"Example output:
current log level is typespec_client_core::http::policies::logging=warn,hickory_server::server::server_future=off,rmcp=warn,debugTail the proxy logs.
kubectl logs -n <namespace> deploy/<gateway-name> -f
You can also set fine-grained levels per module by using the same RUST_LOG filter syntax, such as info,proxy::httpproxy=trace.
Capture profiles
Agentgateway includes pprof endpoints to help you investigate CPU and memory issues.
Optional: If you have not already, download Graphviz to visualize the profiles.
Open a port-forward to the proxy.
kubectl port-forward deploy/<gateway-name> -n <namespace> 15000 &Capture a CPU profile. The default duration is 10 seconds; the example uses 30 seconds.
curl -o cpu.pprof "http://localhost:15000/debug/pprof/profile?seconds=30"Capture a heap profile.
curl -o heap.pprof http://localhost:15000/debug/pprof/heapInspect the profiles with
go tool pprof.CPU profile
go tool pprof -http=: cpu.pprofHeap profile
go tool pprof -http=: heap.pprofGraphviz opens on your web browser to a UI on localhost. Example:
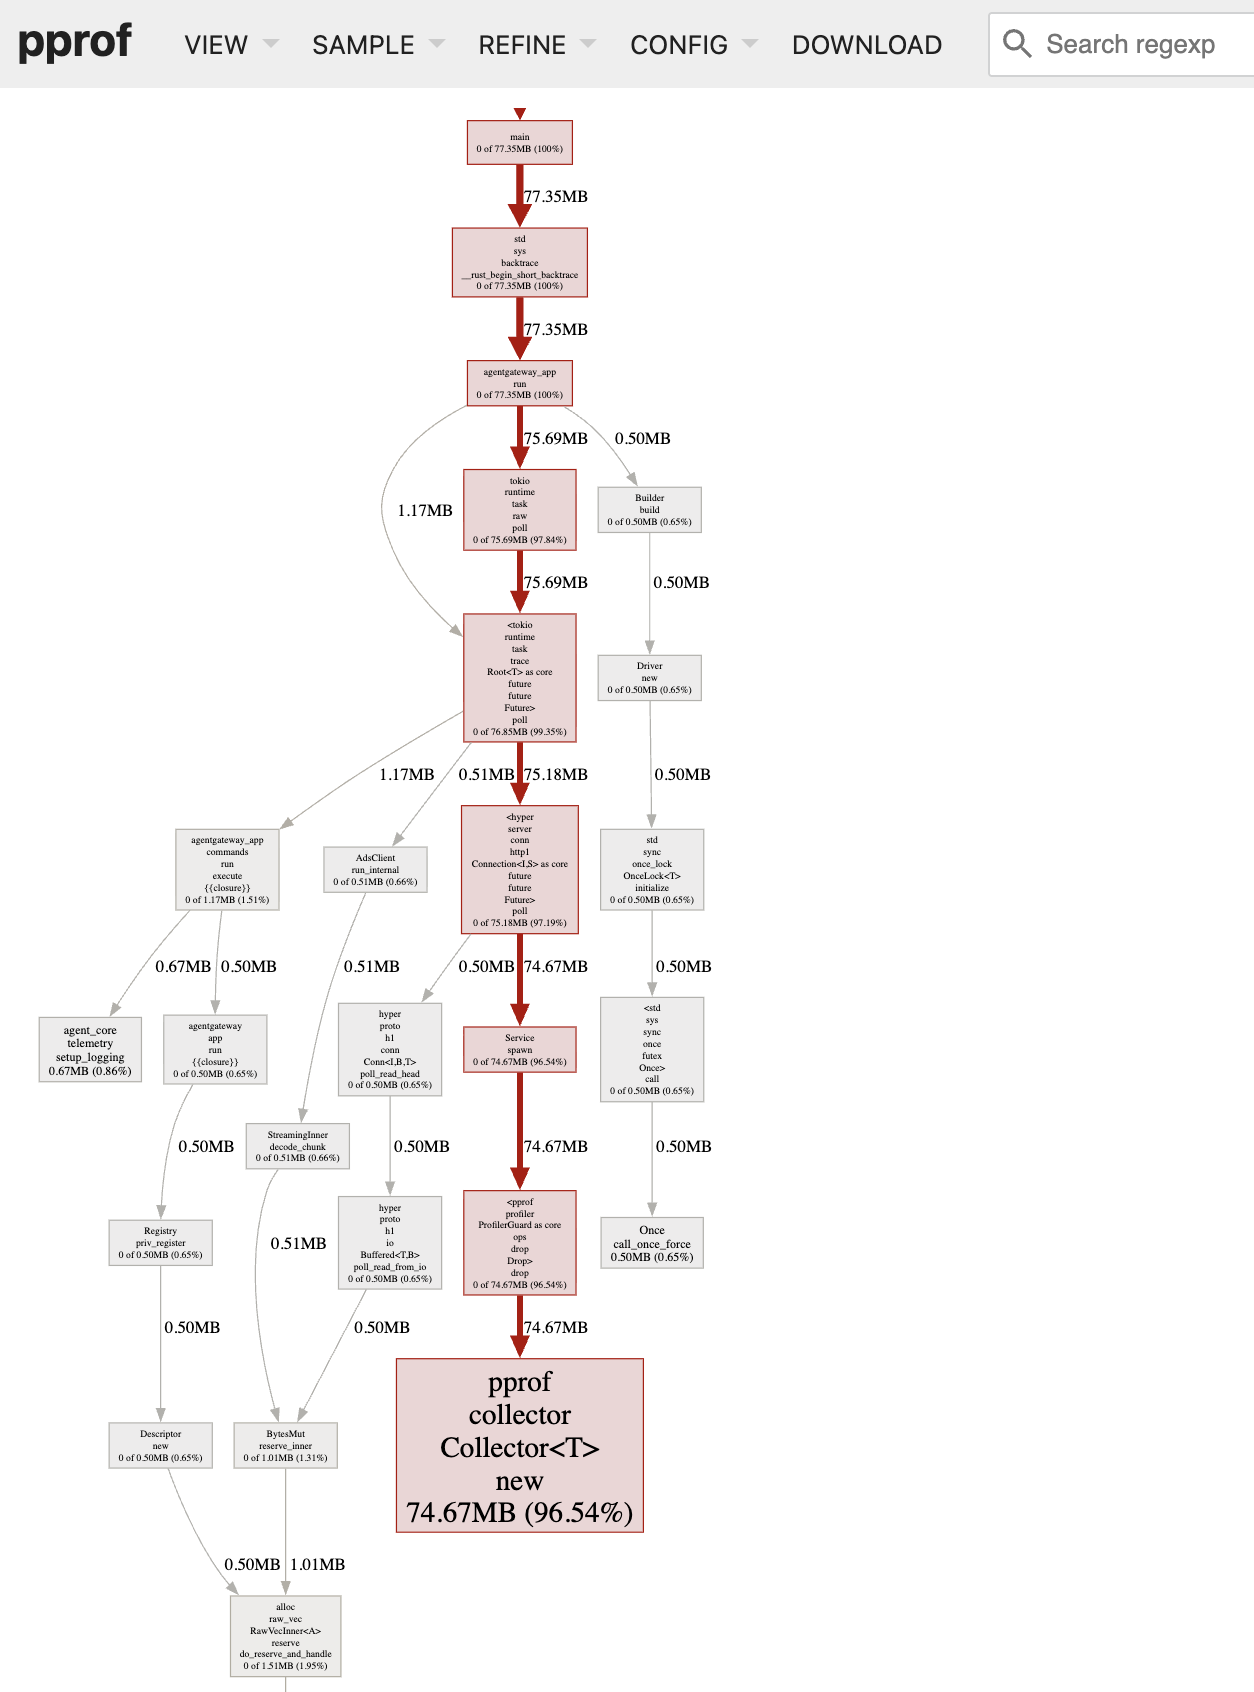
Heap profile graph Heap profile graph
